
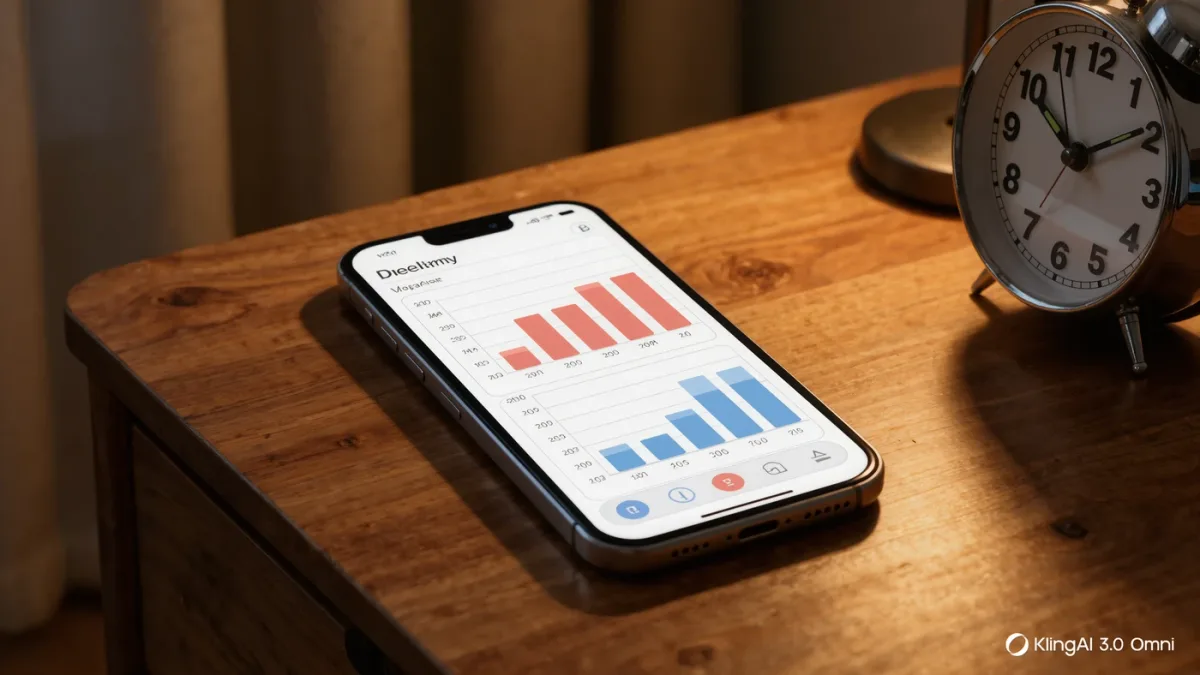
Screen-time reports — the weekly usage summaries built into iOS Screen Time and Android's Digital Wellbeing dashboards — are useful exactly one way: as measurements that inform one structural change at a time, and counterproductive the moment they become a daily guilt score, a pattern consistent with what wellbeing researchers observe about self-monitoring generally, where tracking helps when it guides adjustment and harms when it curdles into surveillance of the self. The number is not the outcome. The number is a thermometer; you are deciding whether to open a window.
RechargeMe publishes information about digital-wellbeing practices, not medical or mental-health advice. Feature names below are as documented by Apple and Google for their built-in dashboards as of late 2025.
What do the dashboards actually measure?
Per Apple's and Google's feature documentation: total time per app, number of pickups and notifications, first and last phone use of the day, and per-app limits you can set. Two documented quirks deserve knowing before you trust the numbers. Device-level counting attributes every foreground second to an app, so background music, navigation, and a call to grandma all count toward "screen time" with equal moral weight. And the pickup count measures unlocks, not attention — a day of fifty two-second glances can look worse than three hours of deliberate reading. Read the report as a sketch with known distortion, not an audit.
Which number is worth reading?
Distribution beats totals. A weekly total of six hours a day is uninterpretable; the same week split into "two hours of navigation and calls, ninety minutes of messaging, two and a half hours of one social app, mostly between 10 p.m. and midnight" is a diagnosis. The single most actionable view in both platforms' dashboards is time-of-day: the late-night block and the first-hour-of-the-morning block are where structure pays best, because they sit at the boundaries of sleep and the day's intentions. The second most actionable is pickups-per-hour during work blocks, which measures fragmentation directly.
How do you turn a reading into a change?
One change, one week, then read the report again. The method is deliberately boring. Pick the single block the report flagged — say, the midnight social-app sessions. Make one structural change: an app timer for that app, a scheduled downtime window, or the phone charging outside the bedroom — the strongest of the three, since it changes the environment rather than testing willpower against a device engineered to win. Let a week pass. Read the report again: did the block shrink, did it move, did pickups just relocate to another app? Relocation is the common outcome and the reason one-change-at-a-time works — you can see it, instead of wondering which of five simultaneous reforms did anything.
| Report signal | What it actually means | Paired structural change |
|---|---|---|
| Late-night block | Use bleeding into sleep boundary | Phone charges outside the bedroom |
| High pickups in work hours | Attention fragmentation | Notification audit; focus mode schedule |
| One app dominating | A loop, not a toolbox | App timer or home-screen removal |
| First-use before 8 a.m. | Day starts in other people's priorities | Morning delay: no phone first hour |
What about the guilt problem?
The failure mode of self-monitoring is well described in behavior-change research generally: measurement becomes mood, bad numbers become bad days, and the report that was supposed to inform starts punishing. Three documented antidotes. Read the report weekly, not hourly — both platforms deliver it that way by default, and resisting the daily peek is part of the practice. Judge trends over months, not weeks; a bad week is weather, a rising quarter is climate. And never set a goal expressed only as a total — "under four hours" — which the dashboard can't help you achieve because totals are outcomes of structure, not levers. Levers are the blocks, the places, and the defaults; totals follow.
Do the built-in tools work for kids' devices too?
Both platforms document family controls built on the same measurement: per-app limits, scheduled downtime, and activity reports visible to a family organizer. The wellbeing considerations for adults apply doubly to children — measurement as the basis for shared agreements rather than covert surveillance, which family-communication researchers consistently find erodes trust without improving habits. The feature works technically; the design of the conversation around it is what determines whether it works humanly. For households negotiating this, the common-sense guidance published by children's-health and pediatric bodies is a reasonable external reference, and pediatricians' own materials — such as those referenced by major children's hospitals — offer age-calibrated starting points.
FAQ
- Are screen-time numbers accurate? Accurate as counts, misleading as meaning: navigation, calls, and music all count, and pickups measure unlocks, not attention. Read distribution and time-of-day, not totals.
- How often should I check the report? Weekly. Daily reading turns measurement into mood; trends over months are the signal worth acting on.
- What's the single highest-value change? Usually structural: the phone charging outside the bedroom addresses the late-night block and the first-use block in one move, without relying on willpower.